Drawing Intron and exon structure of a gene
Gene Showing Introns and Exons
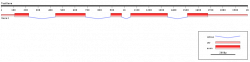
FancyGENE: Its very nice online server to draw gene structure showing intron, exon and UTRs. User need to input the co-ordinates of introns and exons in a table format and server does the rest. Output can be saved as a .pdf or .png file. The detailed information about the server, input and output options can be found here. This web server has been developed by bioinformatics group from Department of Experimental Oncology, European Institute of Oncology, Milan, Italy. Please cite following paper in case this website is useful for you.
Rambaldi D. and Ciccarelli F.D.FancyGene: dynamic visualization of gene structures and protein domain architectures on genomic loci. Bioinformatics. 2009 Sep 1;25(17):2281-2. Epub 2009 Jun 19.
Rambaldi D. and Ciccarelli F.D.FancyGene: dynamic visualization of gene structures and protein domain architectures on genomic loci. Bioinformatics. 2009 Sep 1;25(17):2281-2. Epub 2009 Jun 19.
Domain drawing for proteins
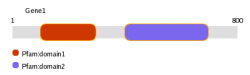
DomainDraw: an online web server for drawing domain structure for a protein. user need to provide the position of domains in their protein and program draws a nice figure depicting domains. It is capable of drawing complex and overlapping domains in given proteins.

My Domain: Expasy webserver for creating custom domain figures for proteins. user need to provide information manually which includes the position of domain, type of structure and color. You can add sites on the sequence or domains.
Idiographica

Idiographica is a web server for you to create your own idiogram. It currently support drawing for following Species , human, mouse, rat and fruit fly. User need to fill the web form to submit drawing information. You can choose what chromosome and what other information should be included in the drawing. The Idiographica server will send an email to notify the completion of the idiogram creation task.
gff2ps

gff2ps is a program for visualizing annotations of genomic sequences. The program takes as input the annotated features on a genomic sequence in GFF format, and produces a visual output in PostScript. It can be used in a very simple way, because it assumes that the GFF file itself carries enough formatting information, but it also allows through a number of options and/or a configuration file, for a great degree of customization. This is a commandline program and need some knowledge and love for unix system. a manual in pdf format can downloaded here. The program itself can be downloaded from here.
The following list shows many features of gff2ps.
The following list shows many features of gff2ps.
- Comprehensive plots for any GFF-feature, attributes are defined separately so you can modify only attributes for same file or share same customization among different data-sets.
- All parameters are set by default within the program, but you also can define a default custom file with all your global settings and a extra custom file for small (or big) changes in one plot.
- User-defined custom files can handle regular expressions, allowing you to set the same variable-attribute for multiple GFF-features.
- Program has been defined as a Unix filter so it can handle data from files, redirections and pipes, writing output to standard-output and warnings to standard error.
- Source order is taken from input files, if you swap file or sources order you can visualize tracks with the new input arrangement.
- gff2ps generates hierarchical plots, where higher level is strand -spliting page blocks in many horizontal regions as strands appear in your files [(+)forward/(-)reverse/(.)no_frame]-, then are drawed source and sequence -plot tracks-, followed by groups and lower level provided by GFF-elements.
- Overlapping groups/elements can be displayed in multiple lines, the minimum number of lines to avoid overlapping among all elements.
- Score controls feature width attribute, when is not defined -"."- in GFF-record maximum value for its source is assumed to visualize it.
- features for which frame is specified are plotted using a two color code schema. The upstream half of the graphical element representing the frame of feature and the downstream half the complement modulus three of its remainder. This is useful to check frame consistency between adjacent features (for instance, predicted exons). Two adjacent features are frame-compatible when the color of the downstream half of the upstream feature matches the color of the upstream half of the downstream feature. This two-color code schema, however, is only meaningful when the frame has been defined relative to the feature, and not relative to the sequence.
- gff2ps is able to manage many physical page formats (from A0 to A10, and more -see available page sizes in its manual-), including user-defined ones. This allows, for instance, the generation of poster size genomic maps, or the use of a continuous-paper supporting plotting device, either in portrait or landscape. It's also possible to obtain multiple horizontal and/or vertical pagination.
Argo Genome Browser
The Argo Genome Browser is the Broad Institute's production tool for visualizing and manually annotating whole genomes. This free and open source standalone Java 1.4 application provides:
- Display of sequence and annotation tracks (from FASTA, Genbank, GFF, BLAST, BED, Wiggle (WIG), and Genscan files)
- Extensive customization options
- Interactive zoom from megabase to nucleotide resolution
- Editing of individual features, supporting manual annotation
- Intuitive and elegant comparative perspective (ComBo) for viewing dot plots of multiple aligned sequences.
- Can be run as Applet or Webstart application as well as standalone application. Applet can be downloaded from here.
Venn digram drawing : VENNY
Oliveros, J.C. (2007) VENNY. An interactive tool for comparing lists with Venn Diagrams.
http://bioinfogp.cnb.csic.es/tools/venny/index.html.
http://bioinfogp.cnb.csic.es/tools/venny/index.html.
Draw organellar genome (OGDRAW)
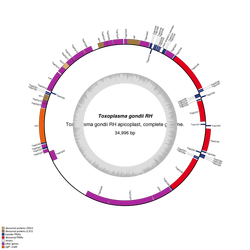
OrganellarGenomeDRAW is dedicated to convert genetic information stored in GenBank entries to graphical maps. The input text file has to be in GenBank flat file format, whereas the output format can be chosen among several formats. The application is especially optimized and adapted for the creation of high-quality, detailed circular maps of organellar genomes like the plastid genome (plastome) or the mitochondrial genome (chondriome). Nevertheless, you can upload any GenBank entry. The workflow is devided into three steps. When using OGDRAW, please cite the following reference (content Copied from OGDRAW website)
OrganellarGenomeDRAW (OGDRAW) - a tool for the easy generation of high-quality custom graphical maps of plastid and mitochondrial genomes. Lohse, M., Drechsel, O. and Bock, R. Curr. Genet. (2007) 52:267-274.
OrganellarGenomeDRAW (OGDRAW) - a tool for the easy generation of high-quality custom graphical maps of plastid and mitochondrial genomes. Lohse, M., Drechsel, O. and Bock, R. Curr. Genet. (2007) 52:267-274.
